Atmospheric CO2#
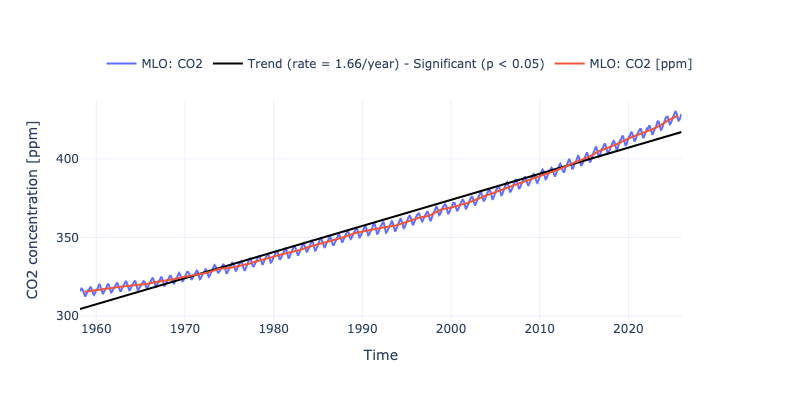
Figure: Monthly Mean Concentration of Atmospheric CO2 at Mauna Loa since 1958. The blue line represents the monthly mean values, centered in the middle of each month. The red line represents the same, after correction for the average seasonal cycle. The solid black line represents the trend, which is statistically significant (p < 0.05). From NOAA ESRL Global Monitoring Division. https://www.esrl.noaa.gov/gmd/ccgg/trends/
In this notebook we will download the data from the Mauna Loa Station and we will create a time series plot and a table summarizing the evolution of CO2 since 1958
Setup#
First, we need to import all the necessary libraries. Some of them are specifically developed to handle the download and plotting of the data and are hosted at the indicators set-up repository in GitHub
Show code cell source
import os

import os.path as op

import numpy as np
import pandas as pd
from myst_nb import glue

import sys
sys.path.append("../../../functions")
from data_downloaders import download_MLO_CO2_data

sys.path.append("../../../../indicators_setup")
from ind_setup.plotting_int import plot_timeseries_interactive, fig_int_to_glue
Observations from Mauna Loa#
First we download our data from the Atmospheric C02 from the Mauna Loa Observatory (ESRL at NOAA)
And we’ll establish our directory for saving and reading data, and our output files.
The function download_MLO_CO2_data will be in charge of processing the data converting to the right units,
The next code block:
extracts CO2 data from 1958
process NaN values
generate an easy to use dataframe
The resulting data is stored in the variable ‘MLO_data’ and saved in “path_data” as ‘MLO_co2.pkl’
update_data = False
path_data = "../../../data"
path_figs = "../../../matrix_cc/figures"
url = 'https://gml.noaa.gov/webdata/ccgg/trends/co2/co2_mm_mlo.txt'

if update_data:
    MLO_data = download_MLO_CO2_data(url)
    MLO_data.to_pickle(op.join(path_data, 'MLO_co2.pkl'))
else:
    MLO_data = pd.read_pickle(op.join(path_data, 'MLO_co2.pkl'))
Analysis#
At this piece of code we will create a new column with the deseasoned CO2 using an open window of 12 months for each data point
MLO_data['CO2_deseasoned'] = MLO_data['CO2'].rolling(window=12, center=True).mean()
glue("n_years", len(np.unique(MLO_data.index.year)), display=False)
glue("co2_2024", int(MLO_data.loc['2024'].CO2.mean()), display=False)
glue("start_year", MLO_data.dropna().index[0].year, display=False)
Plot the timeseries#
Here, we’ll plot the CO2 time series. For that purpose we are creating a dictionary with all the lines that we want to plot in the same figure.
In this specific case, we are going to plot the raw CO2 monthly data, as well as the deseasoned one.
The figure will as well show the linear trend that results for fitting the data over time, showing wether the trend is or not statistically significant (p_value over or above .05) and the value of the trend
dict_plot = [{'data' : MLO_data, 'var' : 'CO2', 'ax' : 1, 'trendline' : True, 'label' : 'MLO: CO2'},
             {'data' : MLO_data, 'var' : 'CO2_deseasoned', 'ax' : 1, 'trendline' : False, 'label' : 'MLO: CO2 [ppm]'}]
fig, trend = plot_timeseries_interactive(dict_plot, trendline=True, figsize=(20, 10), return_trend=True,
                                         label_yaxes = 'CO2 concentration [ppm]');
fig.write_html(op.join(path_figs, 'F1_CO2_trend.html'), include_plotlyjs="cdn");


glue("trend", float(trend[0]), display=False)
glue("change", float(trend[0]*len(np.unique(MLO_data.index.year))), display=False)
glue("trend_fig", fig_int_to_glue(fig), display=False)
Fig. Monthly Mean Concentration of Atmospheric CO2 at Mauna Loa since 1958. The blue line represents the monthly mean values, centered on the middle of each month. The red line represents the same, after correction for the average seasonal cycle. The solid black line represents the trend, which is statistically significant (p < 0.05). The annual oscillations at Mauna Loa are due to the seasonal imbalance between the photosynthesis and respiration of plants on land. From NOAA ESRL Global Monitoring Division. https://www.esrl.noaa.gov/gmd/ccgg/trends/
Generate table#
The final step is to generate a table sumarizing different metrics of the data analyzed in the plots above
from ind_setup.tables import style_matrix, table_co2

style_matrix(table_co2(MLO_data, trend))
/Users/laurac/Library/Mobile Documents/com~apple~CloudDocs/Projects/CC_indicators/CC_indicators/notebooks_historical/atmosphere/1_greenhouse_gases/../../../../indicators_setup/ind_setup/tables.py:353: FutureWarning:

Styler.applymap has been deprecated. Use Styler.map instead.
| Metric | Value |
|---|---|
| Mean CO2 Concentration (ppm) | 360.692 |
| Change in CO2 Concentration since 1951 (ppm) | 122.840 |
| Rate of Change in CO2 Concentration (ppm/year) | 1.660 |
Table. Annual Statistics of Atmospheric CO2 at Mauna Loa since 1958.